
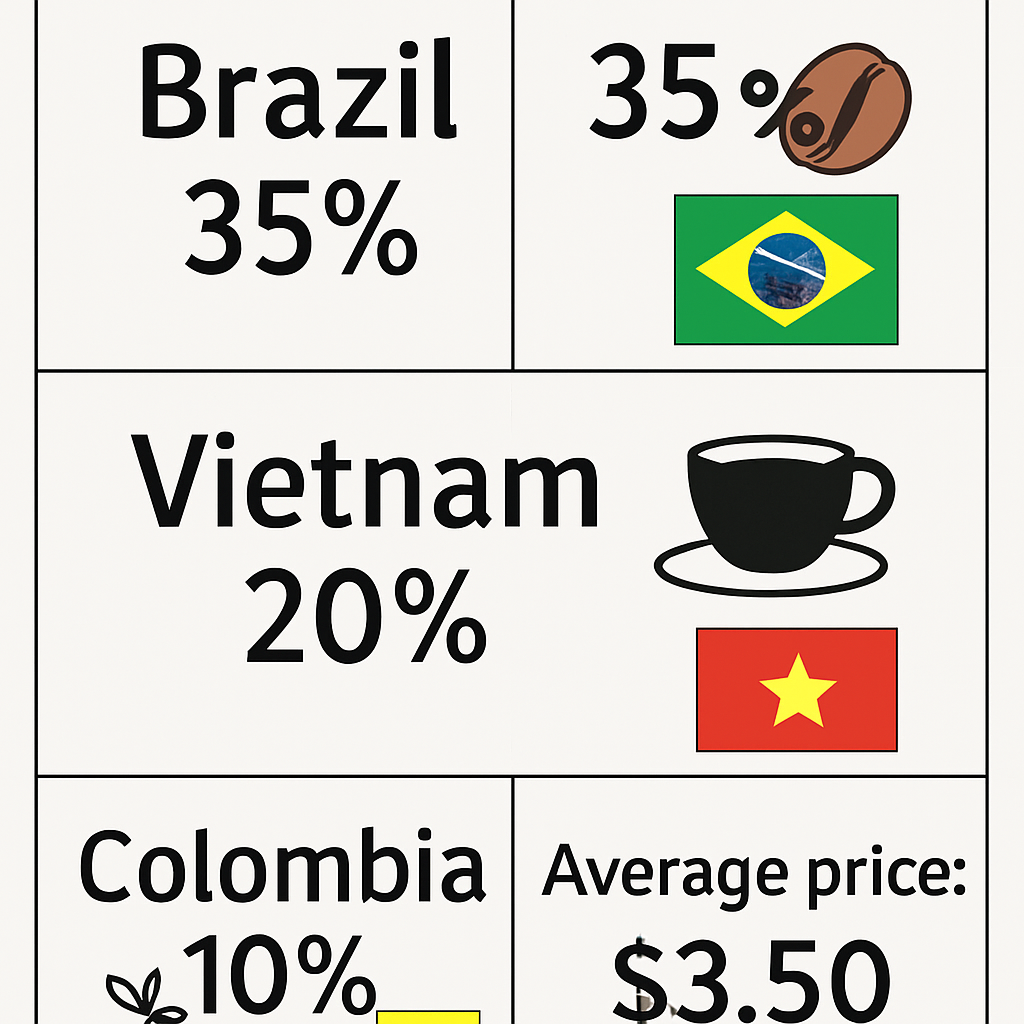


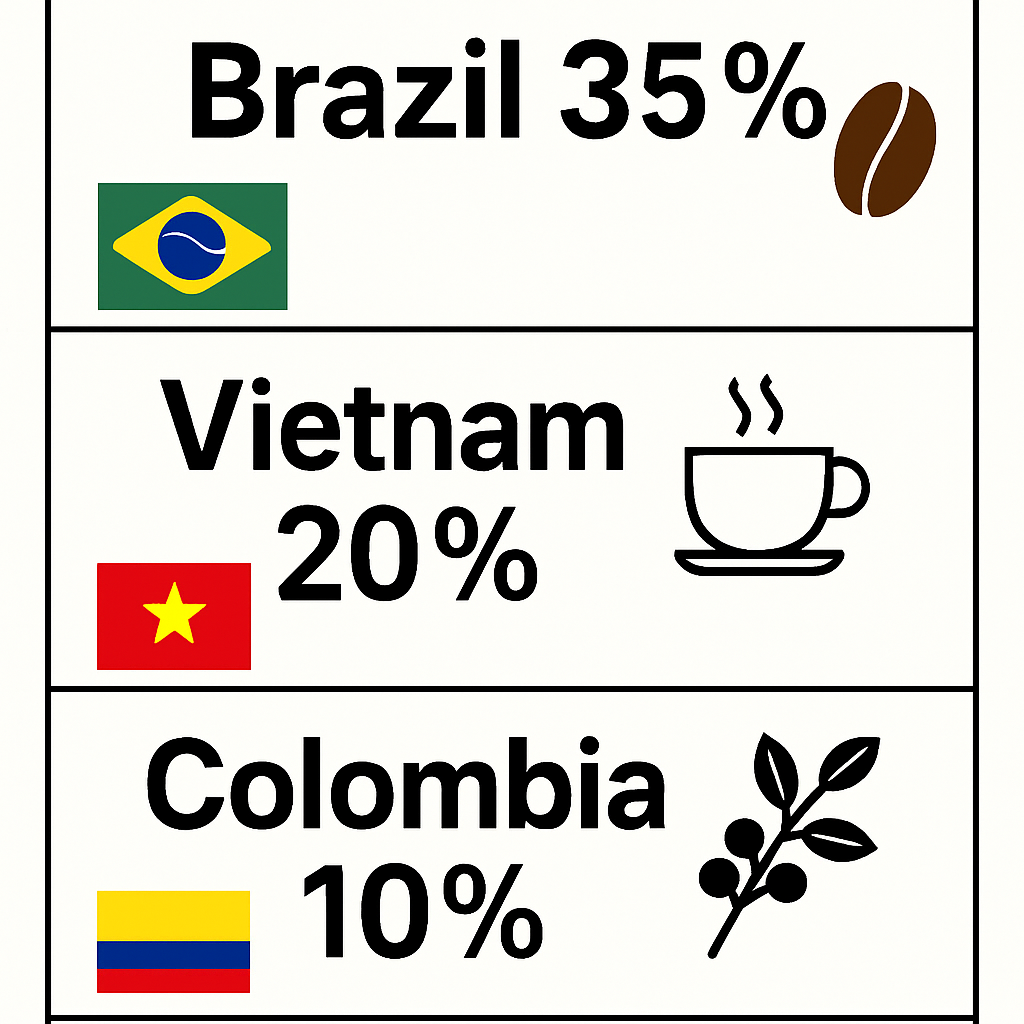
1. **Background**: Solid white or light-colored background for the entire infographic. 2. **Text**: Each piece of information should be written in large, black text, using a minimum font size of 36pt. Ensure the text is clear and legible. 3. **Layout**: - Divide the infographic into four main sections within a grid. Each section should have its own clean space, separated by clear spacing and borders. - The first three sections are dedicated to the coffee production by country: Brazil, Vietnam, and Colombia. The fourth section will display the average price. 4. **Content**: - **First Section**: "Global Coffee Production 2024: Brazil 35%". Accompany this text with a simple icon or symbol of a coffee bean or the Brazilian flag, placed next to the text without overshadowing it. - **Second Section**: "Vietnam 20%". Include a simple icon or symbol, such as a coffee cup or the Vietnamese flag, next to the text. - **Third Section**: "Colombia 10%". Use a simple icon or symbol, like a coffee plant or the Colombian flag, next to the text. - **Fourth Section**: "Average price: $3.50 per pound." This section can feature a IMPORTANT: Use EXACTLY these numbers and text without any modifications: Global Coffee Production 2024: Brazil 35%, Vietnam 20%, Colombia 10%. Average price: $3.50 per pound.
Free to start · Generate videos and images with AI in seconds