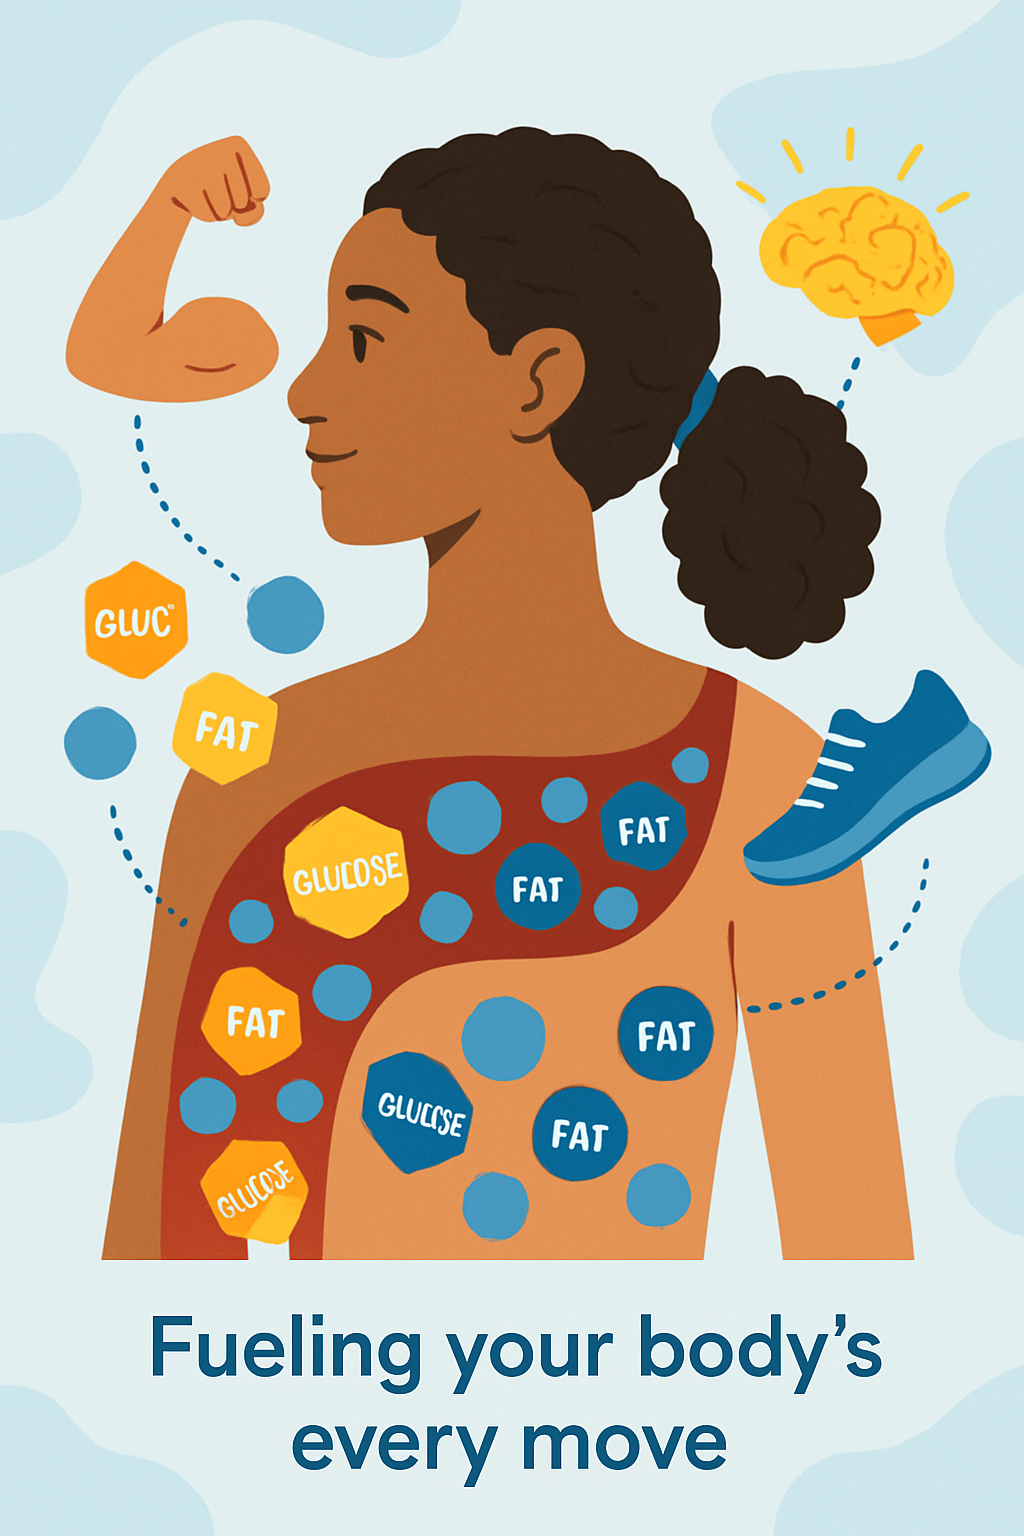
A visually engaging infographic illustrates molecules of glucose and fat, represented by colorful, crisp icons—yellow hexagons for glucose and blue circles for fat—flowing through a stylized bloodstream inside the silhouette of the same young woman with medium brown skin and curly ponytail. Surrounding her are dynamic icons: a flexing muscle arm, a running shoe, and a shining brain, all connected by dotted lines to the fuel molecules. The background is a light blue with abstract shapes, and a minimal caption in a modern font reads: 'Fueling your body’s every move'.. Visual representation of information or data using charts, icons, graphics, and minimal text to make complex information easily understandable.


