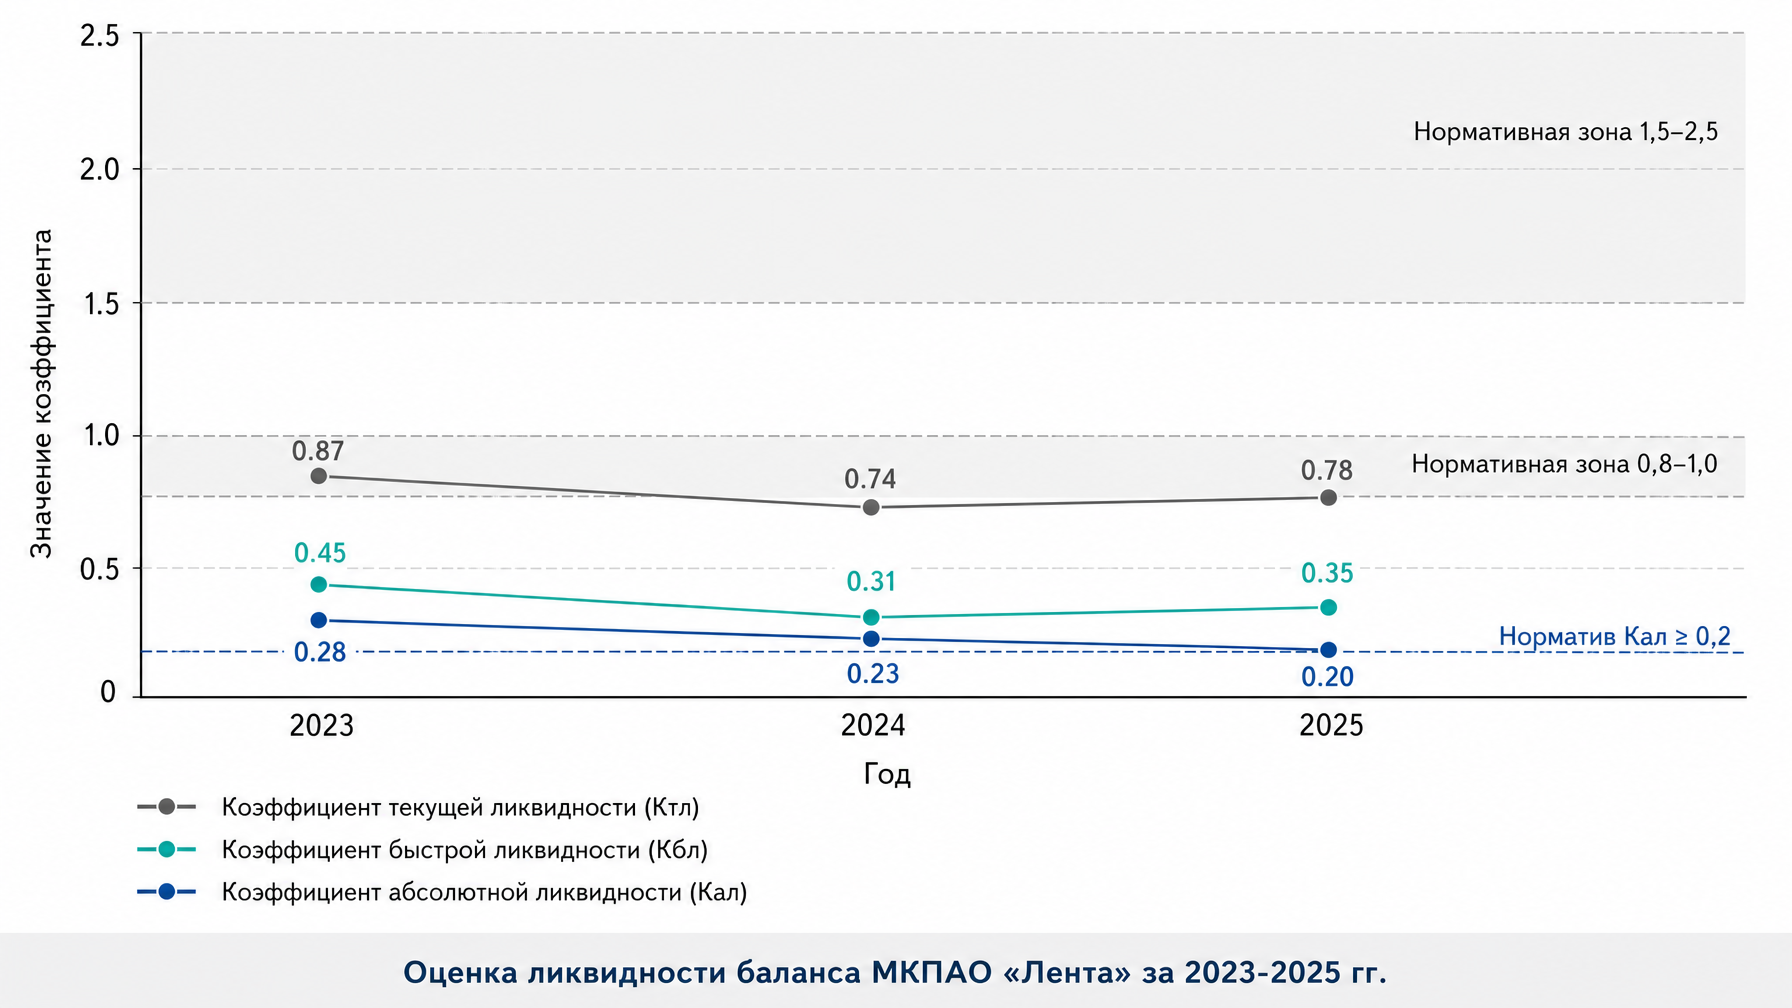
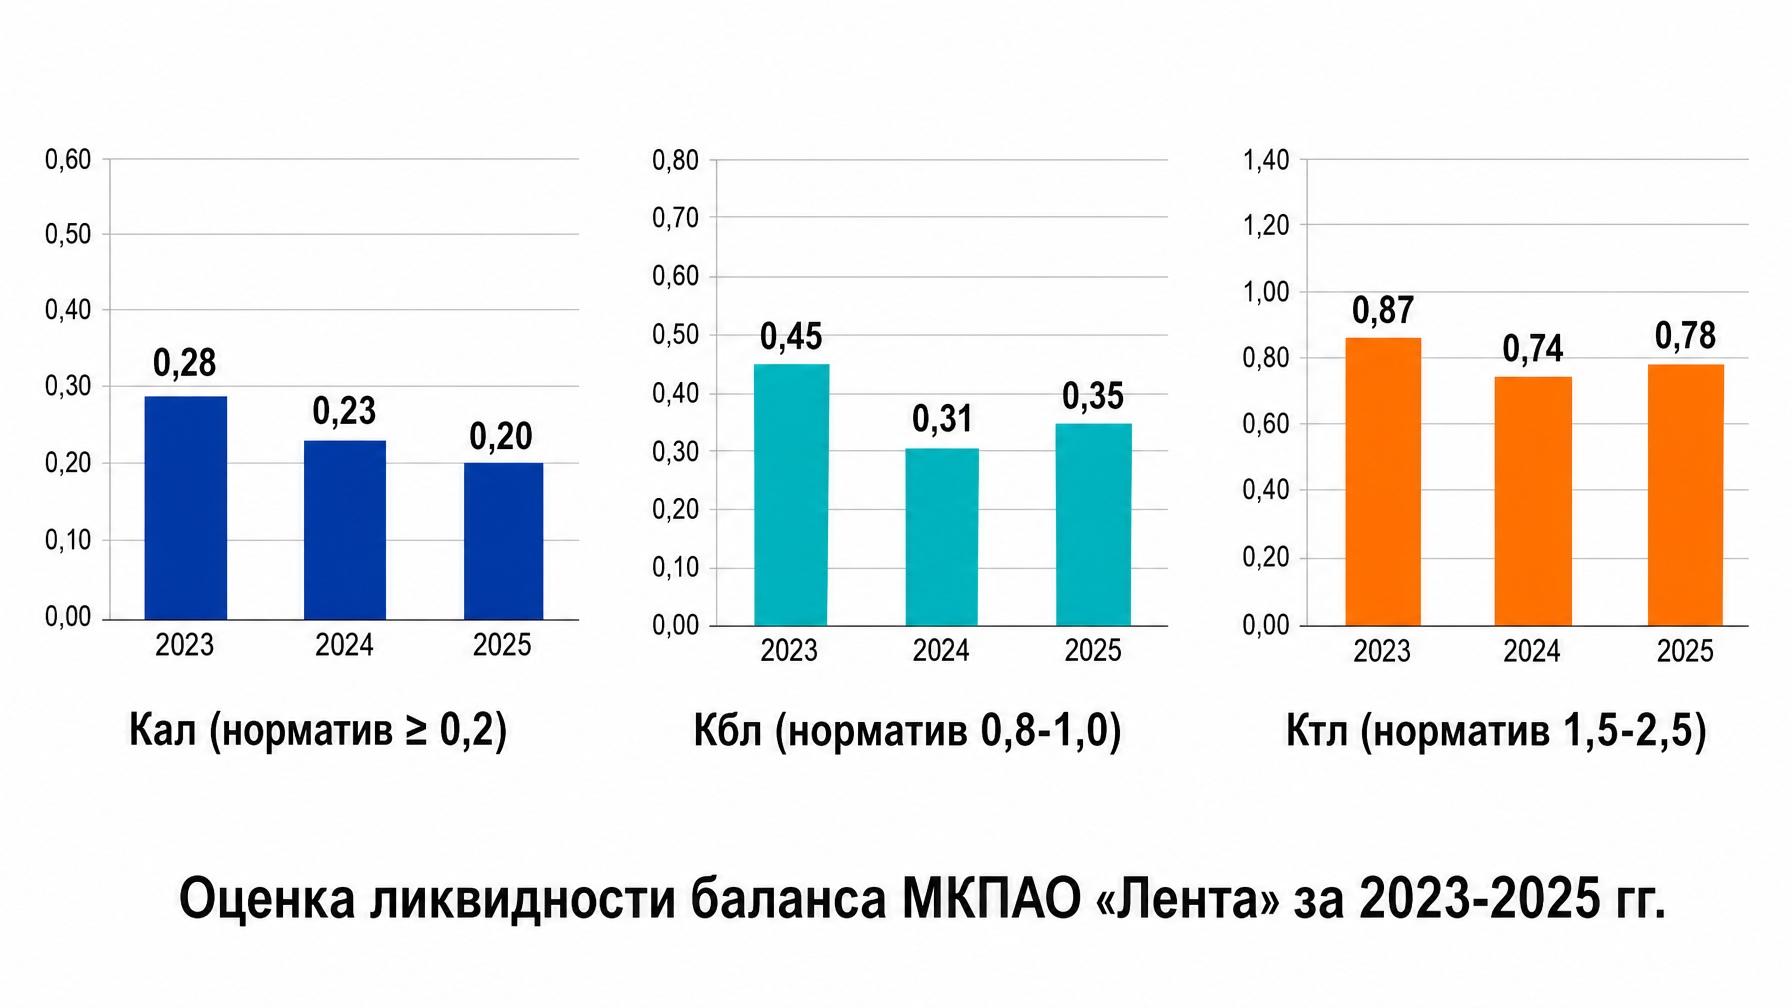
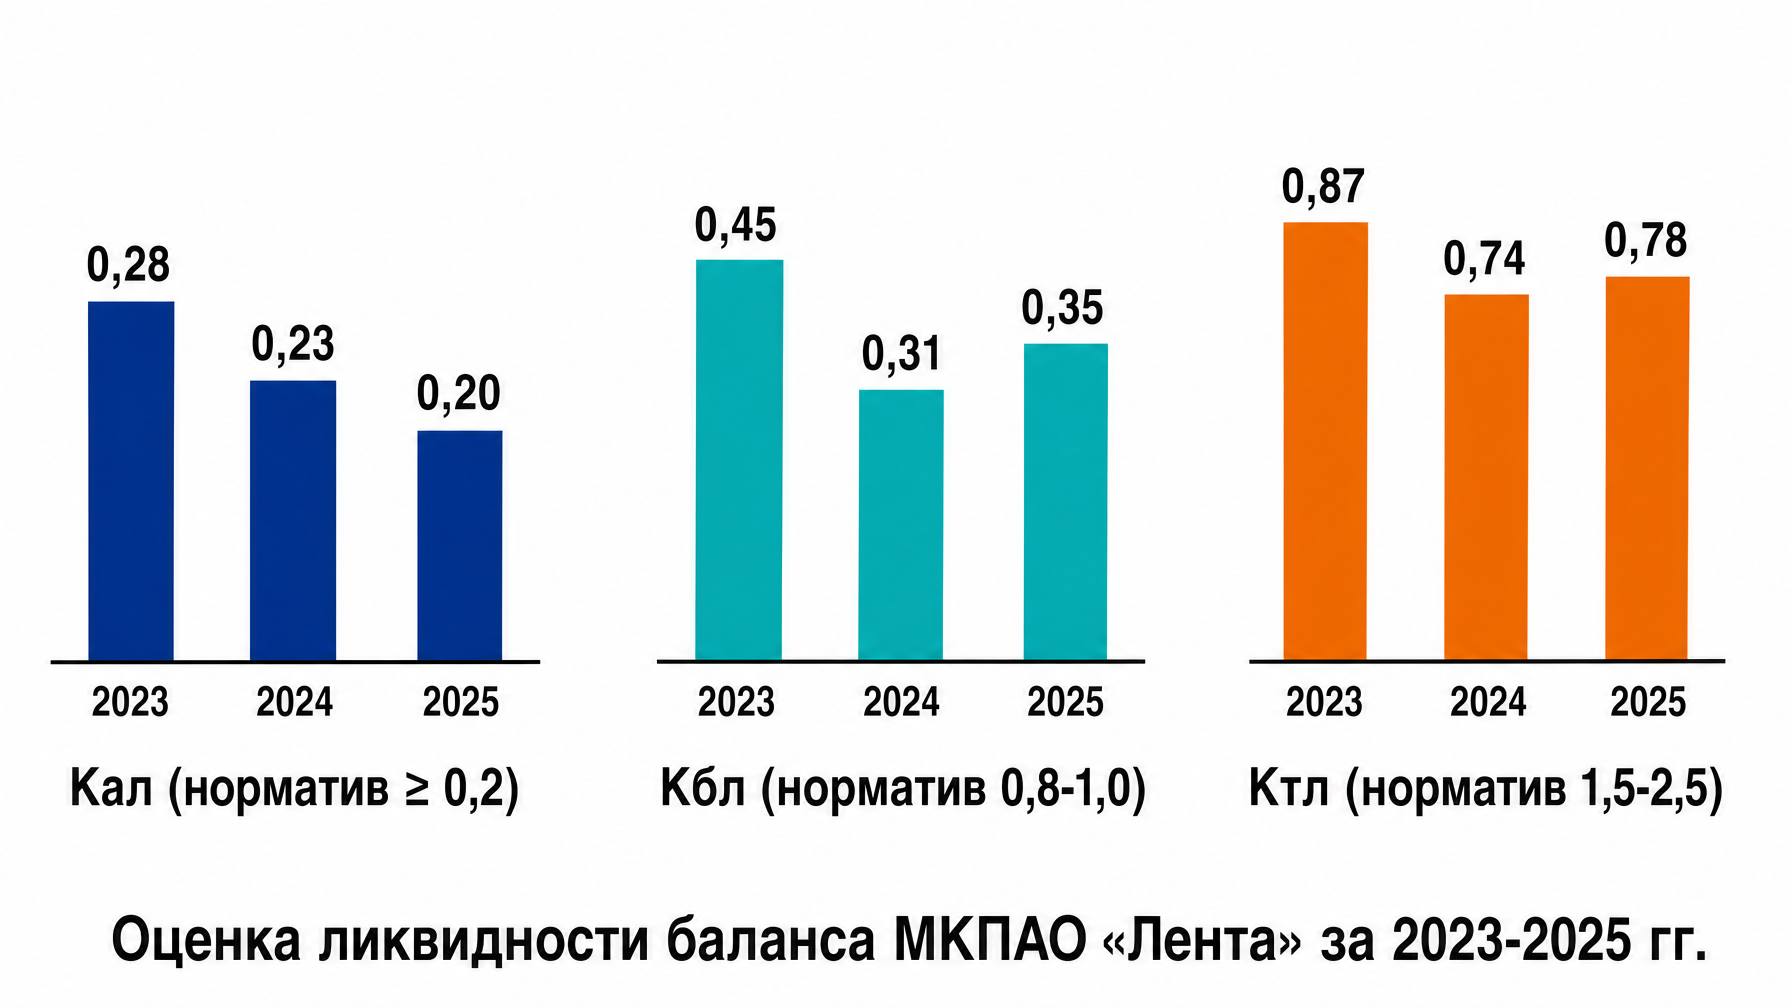
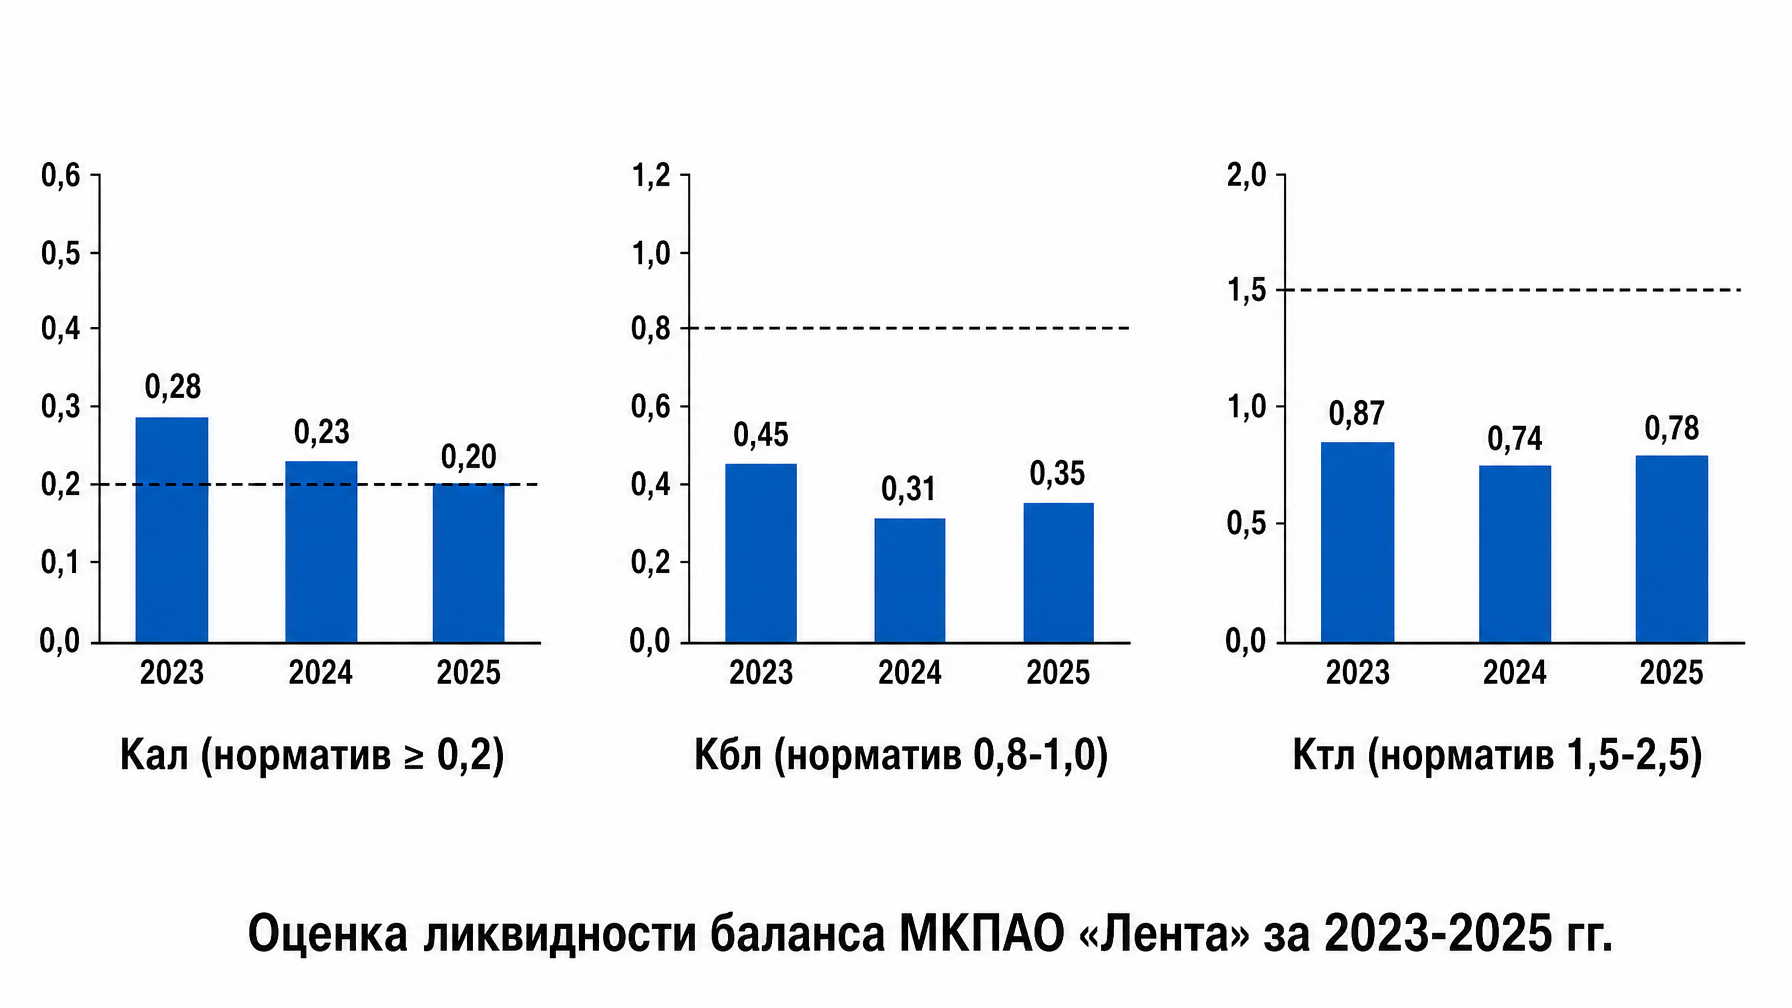
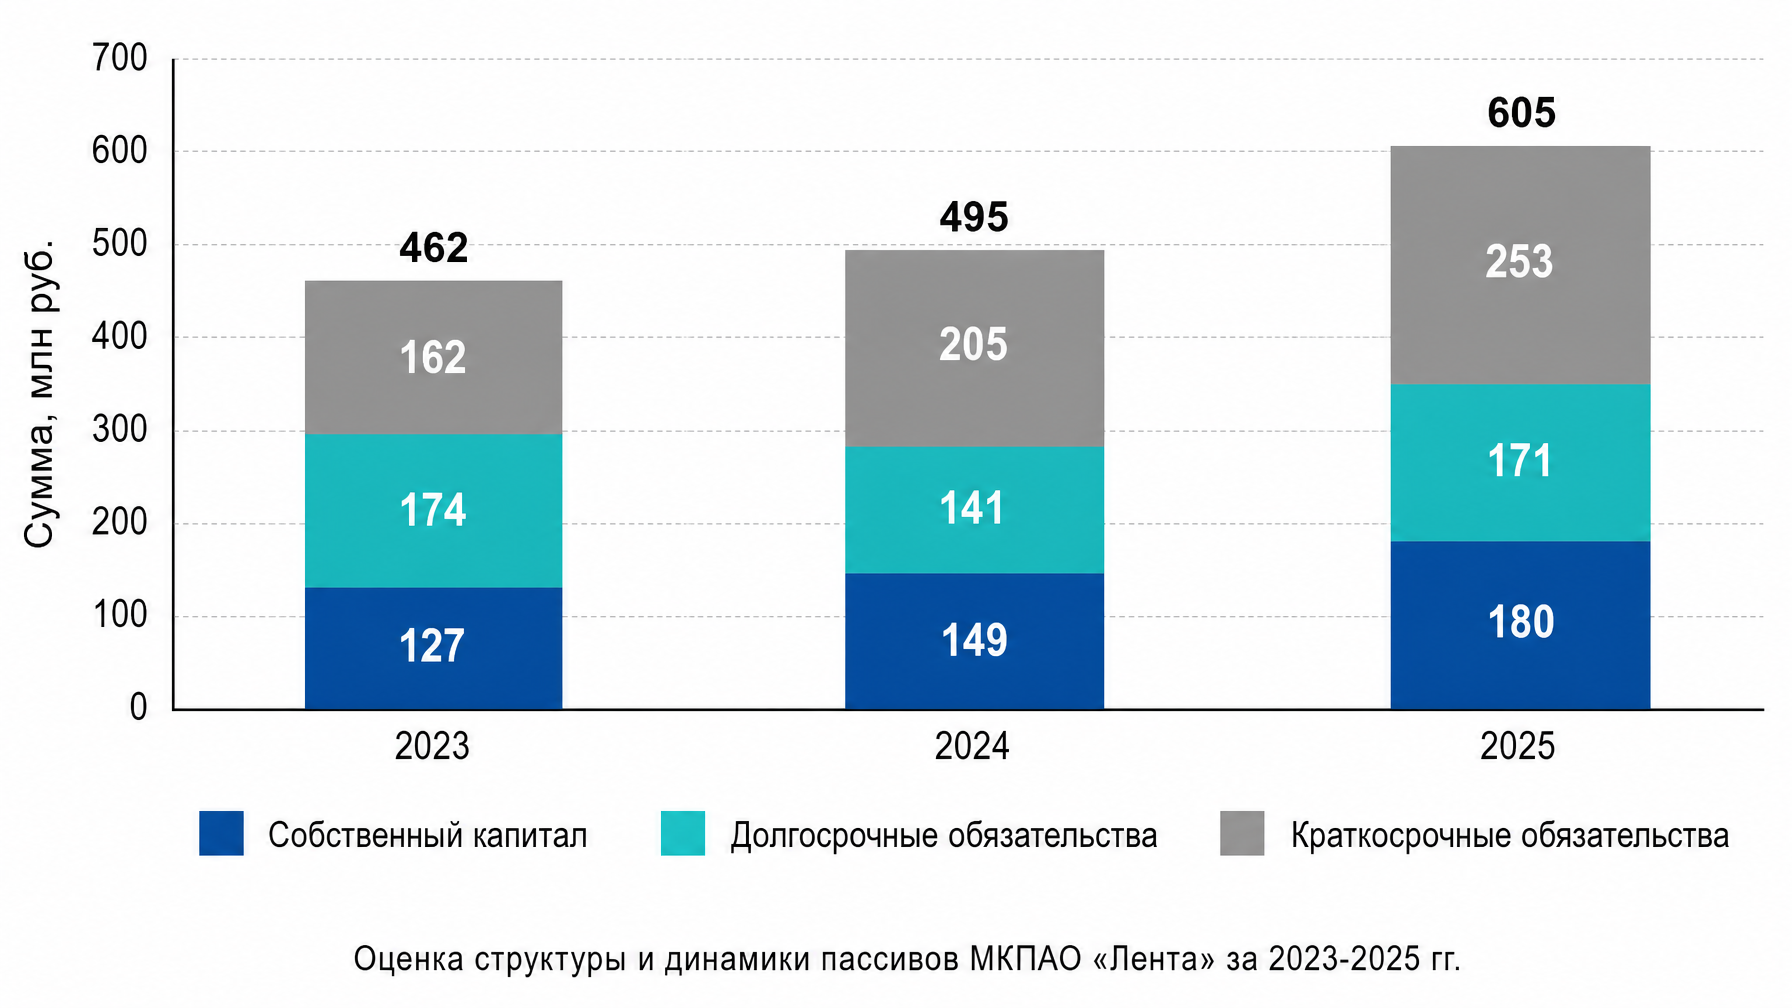
A professional minimalist academic presentation slide, 16:9 aspect ratio. White background. Flat corporate infographic design. A line chart showing liquidity ratios over three years: 2023, 2024, and 2025 on the X-axis. Y-axis ranges from 0 to 2.5. Three distinct lines with data points marked and labeled with exact numbers. Top line (grey): 0.87 in 2023, 0.74 in 2024, 0.78 in 2025. Middle line (turquoise): 0.45 in 2023, 0.31 in 2024, 0.35 in 2025. Bottom line (blue): 0.28 in 2023, 0.23 in 2024, 0.20 in 2025. Include a horizontal dashed line at y=0.2 labeled 'Норматив Кал ≥ 0,2'. Include shaded normative zones or dashed lines for 0.8-1.0 and 1.5-2.5. Legend: Blue line 'Коэффициент абсолютной ликвидности (Кал)', Turquoise line 'Коэффициент быстрой ликвидности (Кбл)', Grey line 'Коэффициент текущей ликвидности (Ктл)'. Footer text at the bottom: 'Оценка ликвидности баланса МКПАО «Лента» за 2023-2025 гг.'. Clean, sharp sans-serif fonts, precise data visualization.