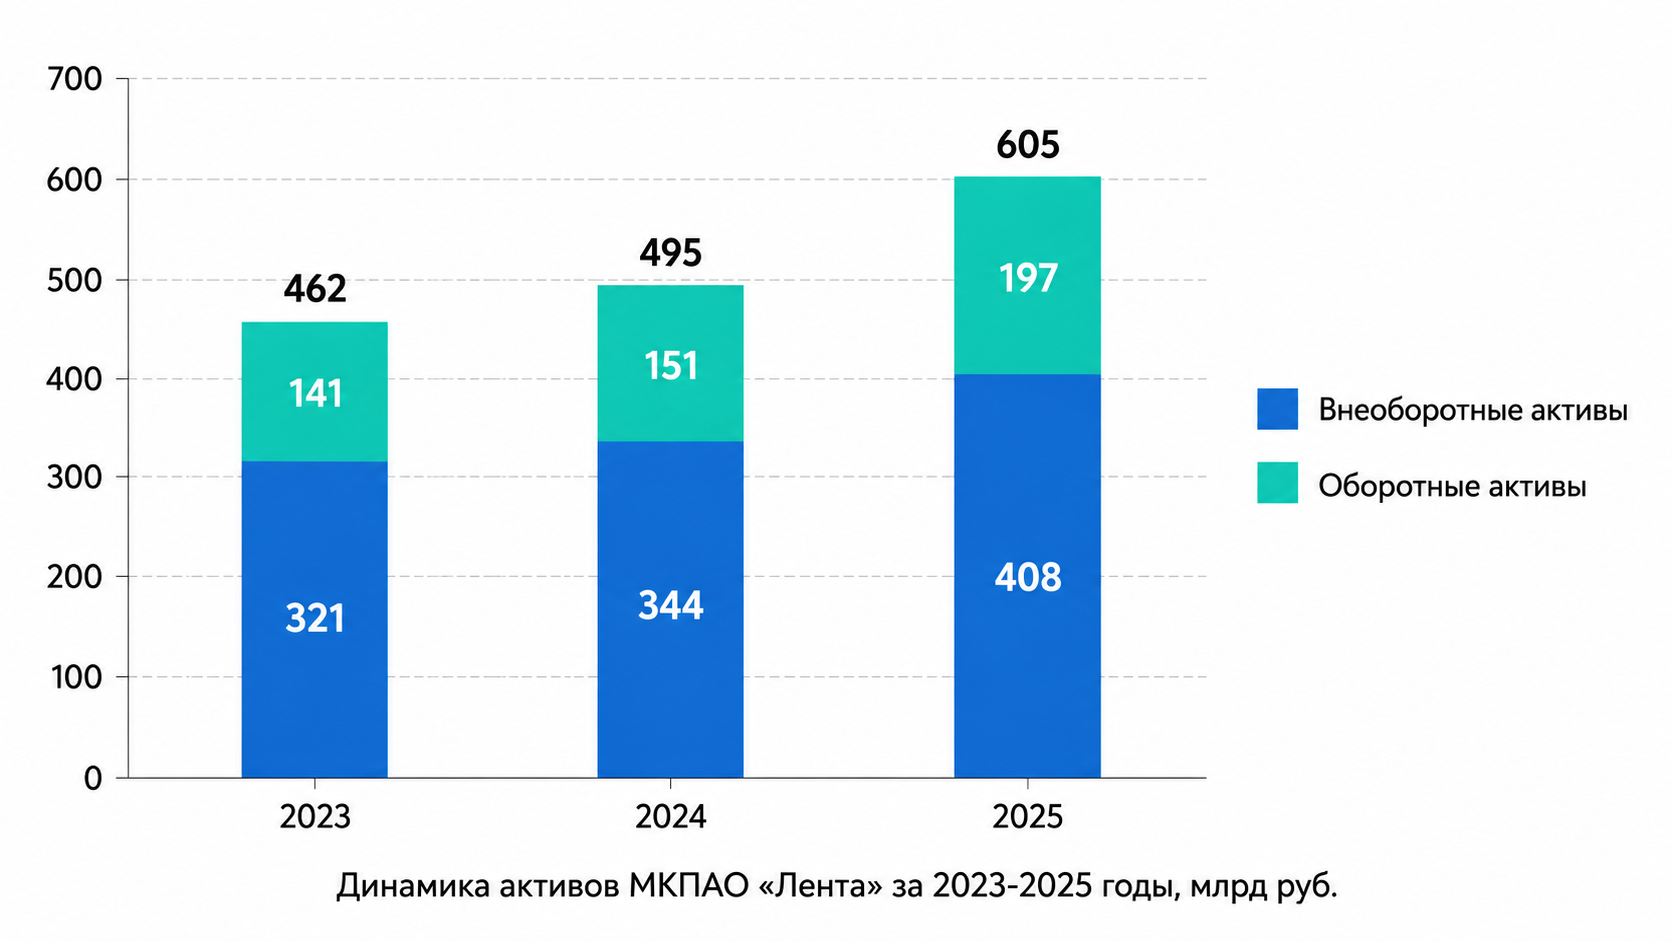
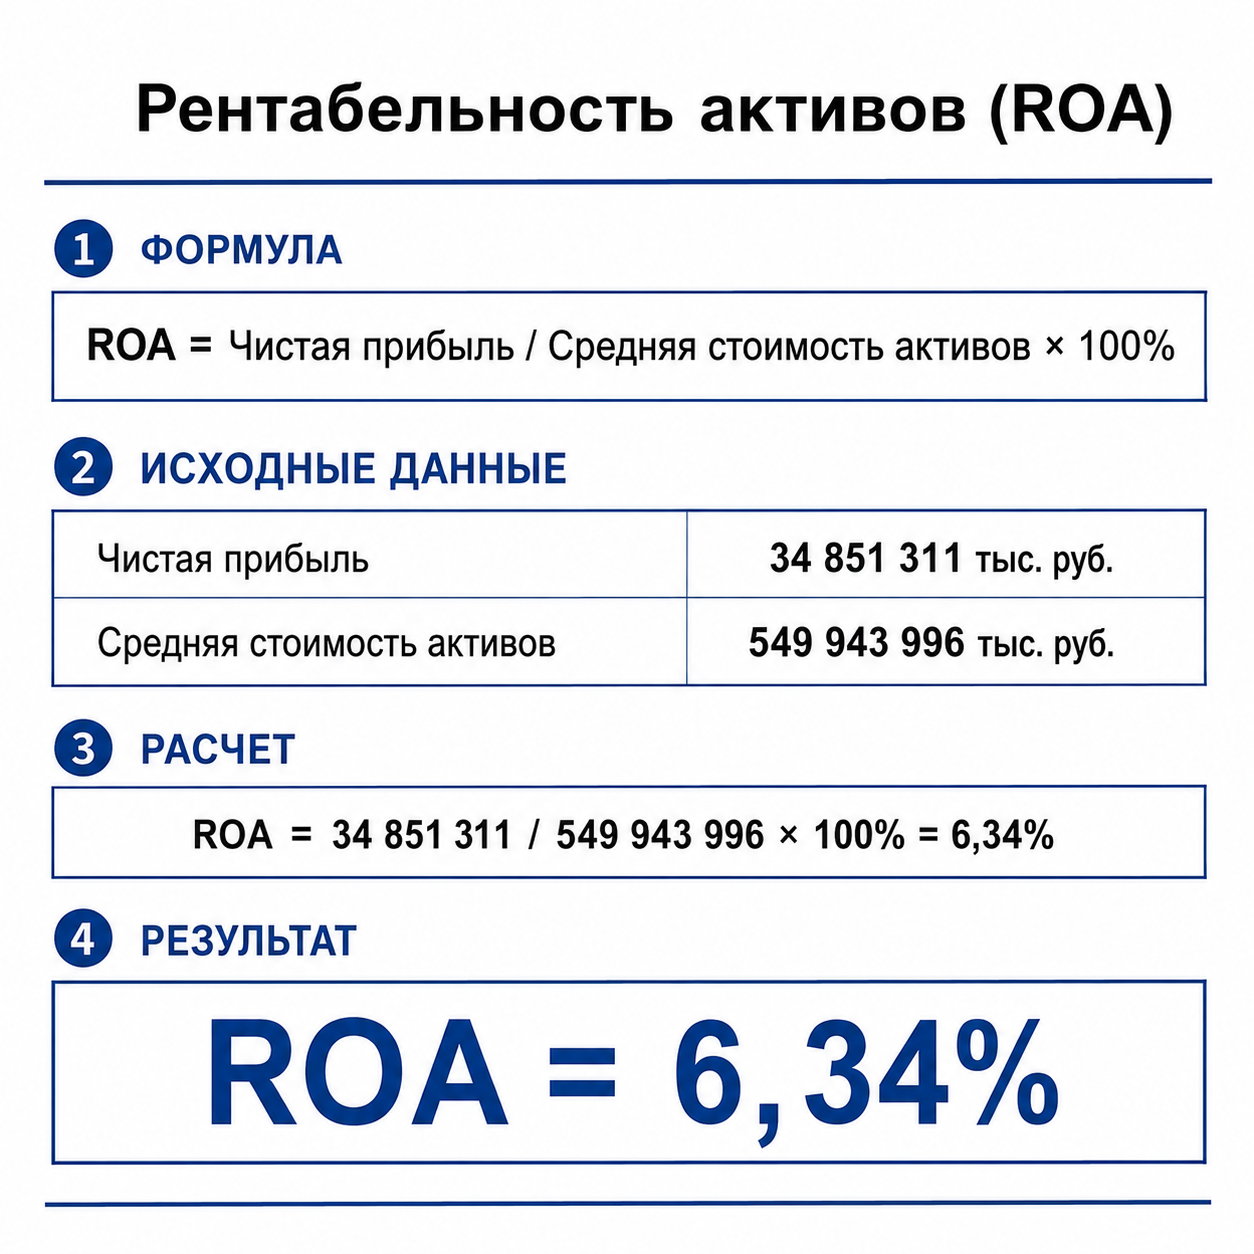
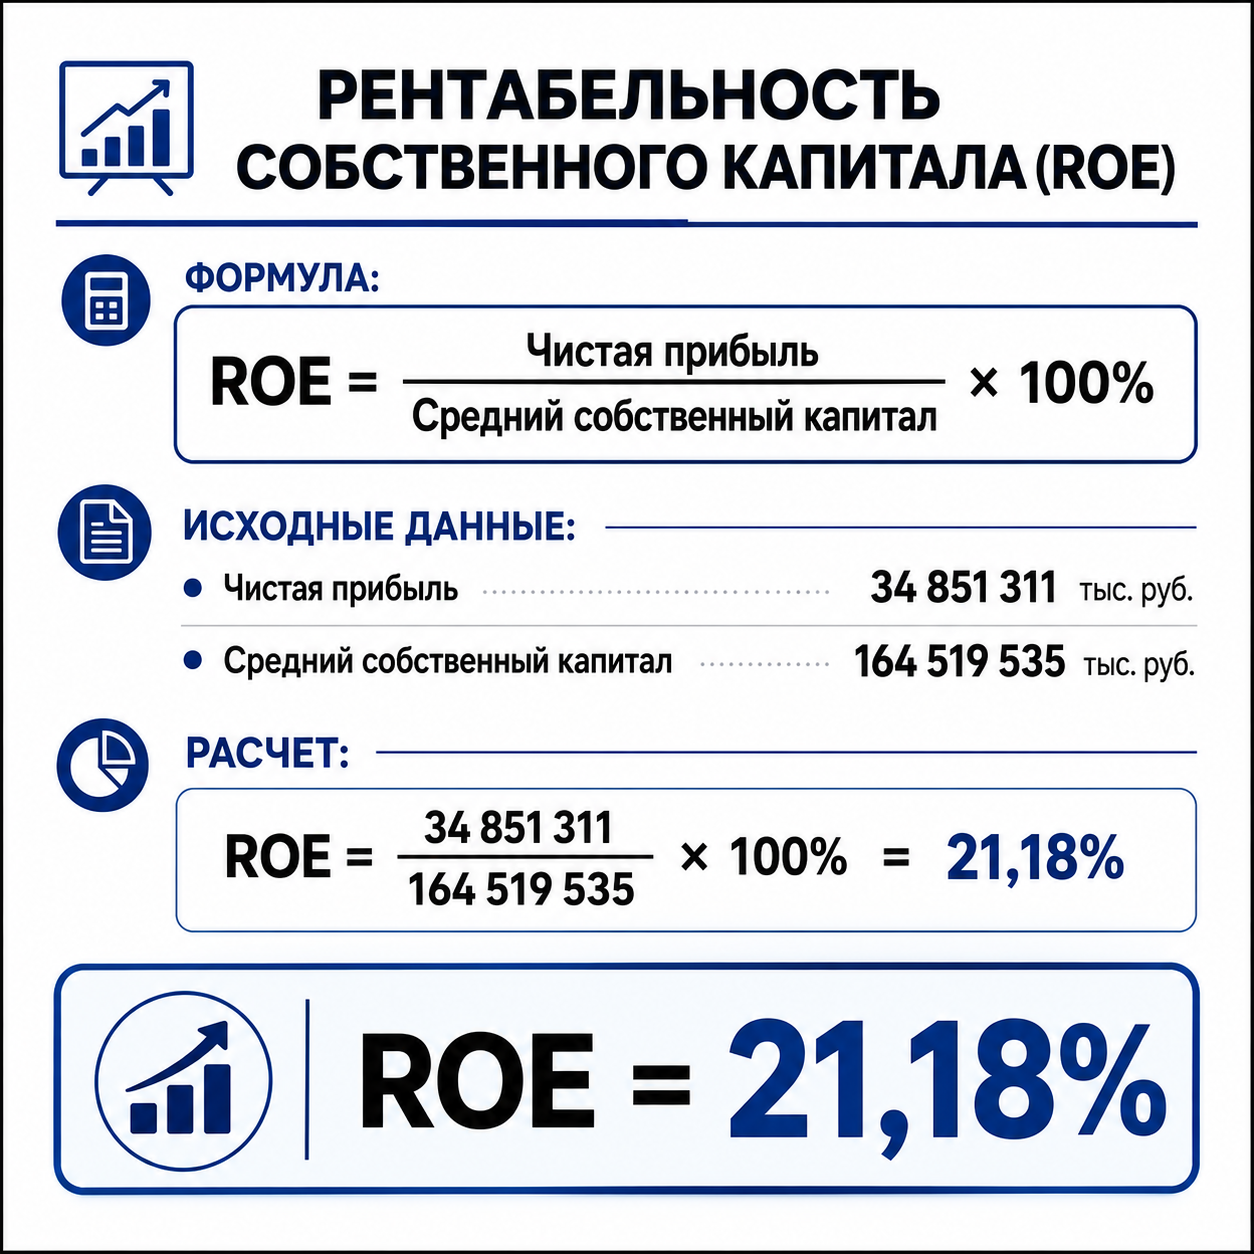
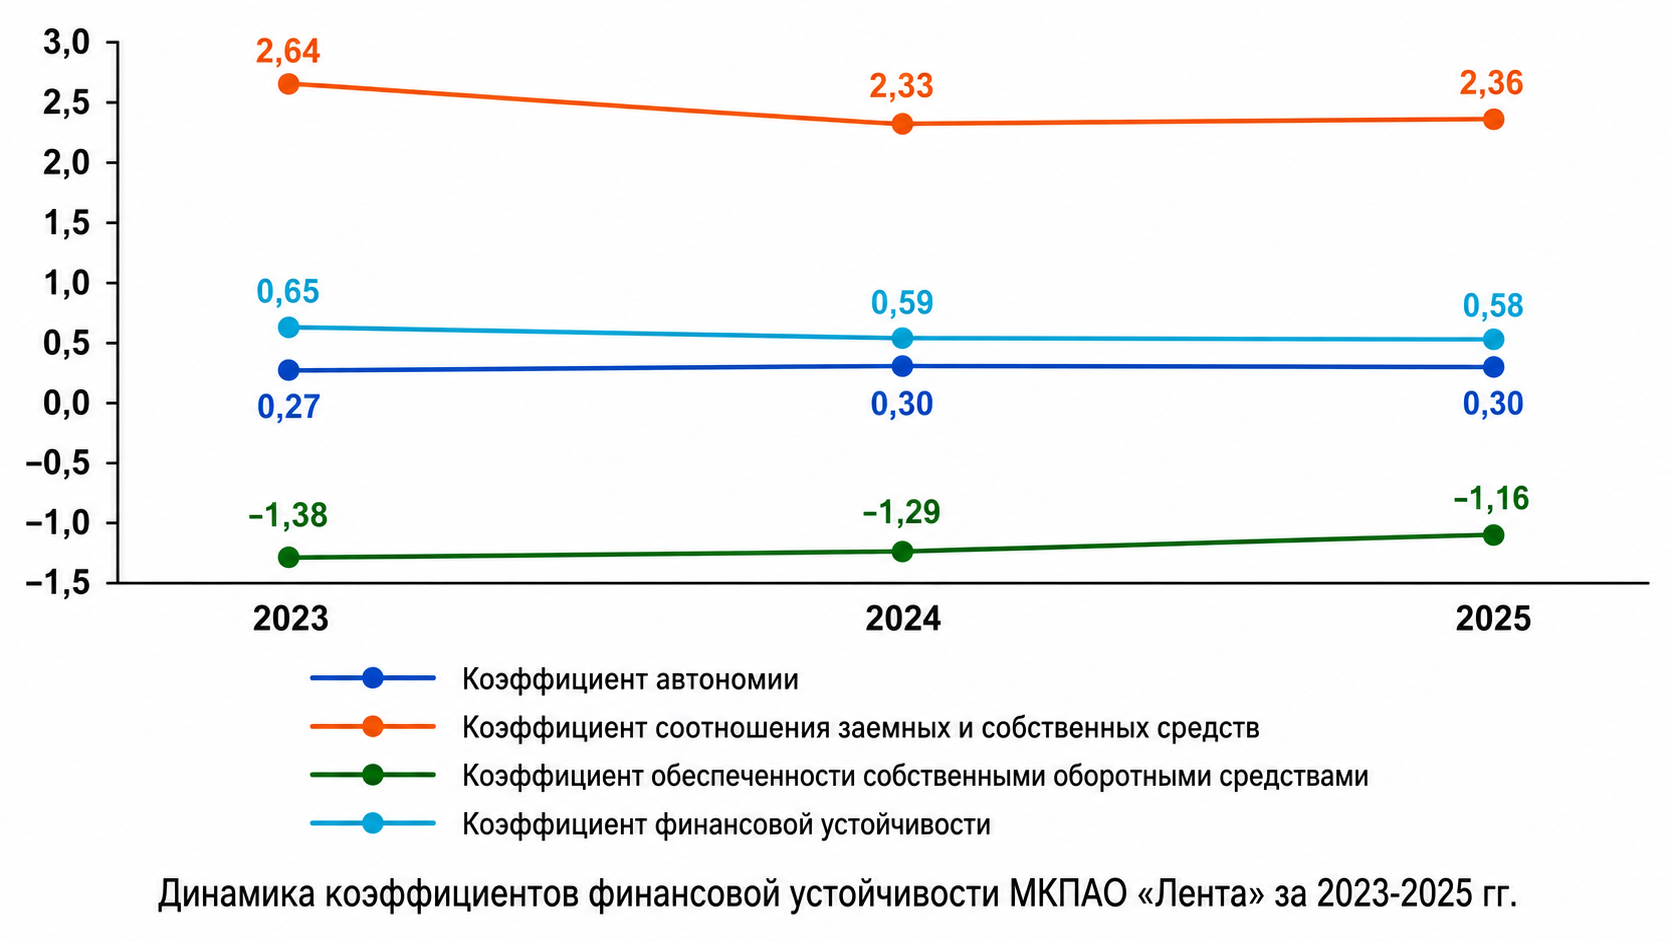
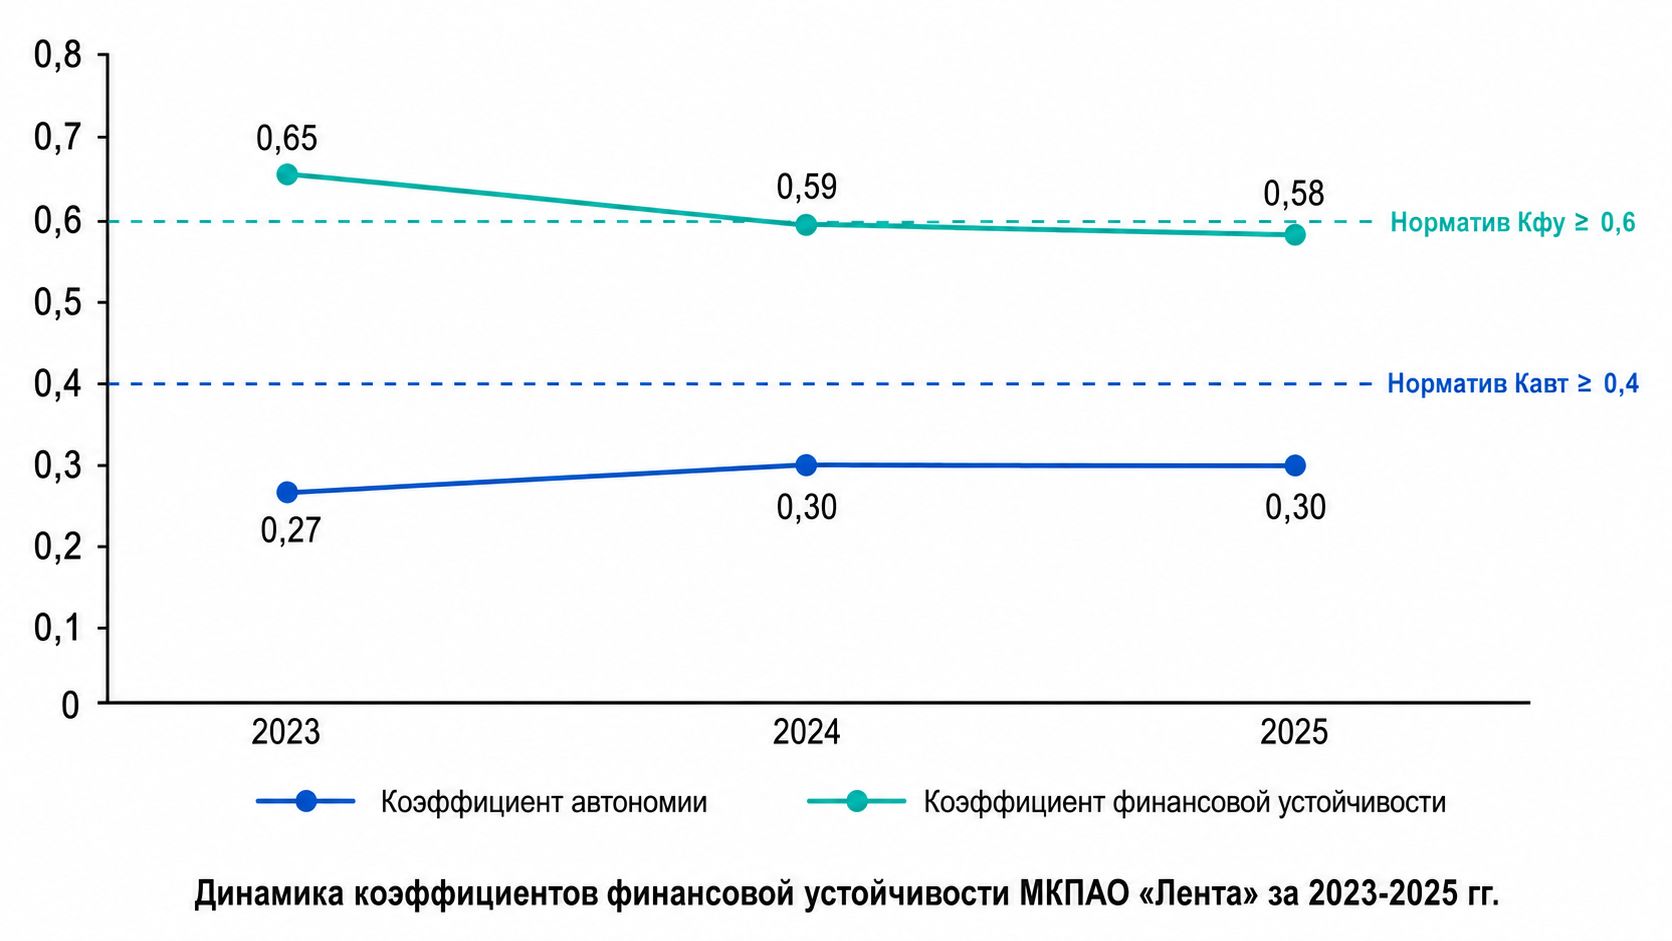


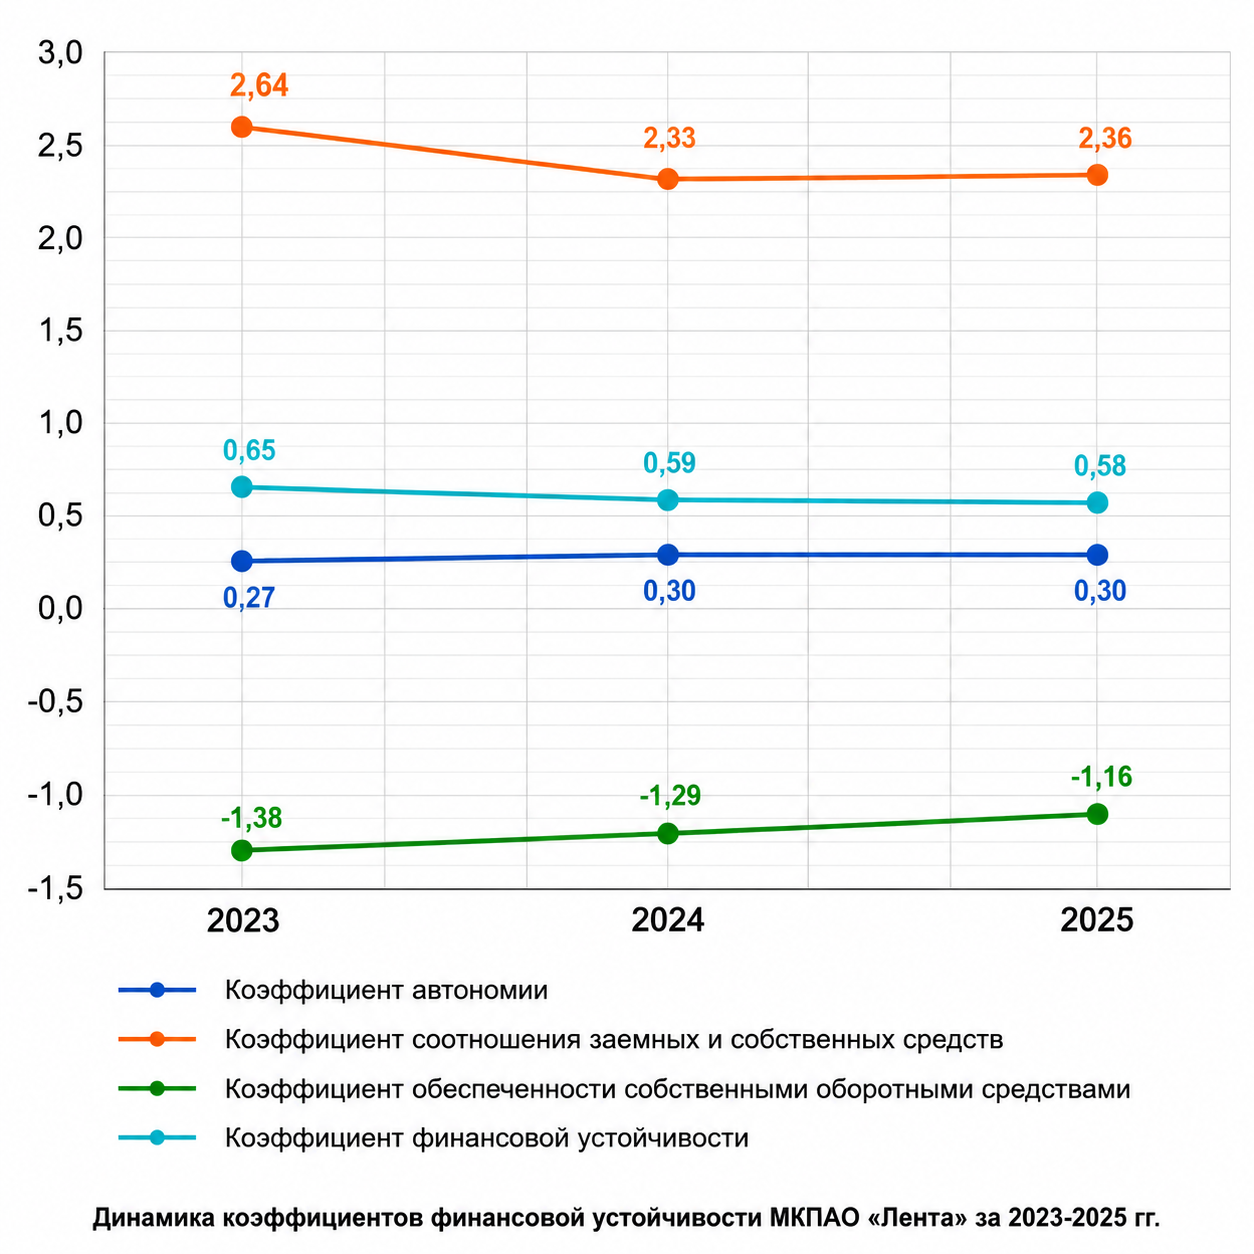
A professional minimalist academic presentation slide, pure white background. Flat corporate infographic design, strict business style. The key change is to make the background grid more prominent and clearly visible. It should be a light gray grid with both horizontal and vertical lines behind the chart. Large, clear sans-serif fonts (Arial style). A single large line chart in the center. Y-axis on the left with numbers ranging from -1,5 to 3,0. X-axis at the bottom with labels: '2023', '2024', '2025'. Line 1: Solid blue line with circular markers. Text values next to markers: '0,27' (2023), '0,30' (2024), '0,30' (2025). Line 2: Solid orange line with circular markers. Text values next to markers: '2,64' (2023), '2,33' (2024), '2,36' (2025). Line 3: Solid green line with circular markers. Text values next to markers: '-1,38' (2023), '-1,29' (2024), '-1,16' (2025). Line 4: Solid turquoise line with circular markers. Text values next to markers: '0,65' (2023), '0,59' (2024), '0,58' (2025). Legend (below chart): - Blue line icon + 'Коэффициент автономии' - Orange line icon + 'Коэффициент соотношения заемных и собственных средств' - Green line icon + 'Коэффициент обеспеченности собственными оборотными средствами' - Turquoise line icon + 'Коэффициент финансовой устойчивости'. Footer text centered at the very bottom: 'Динамика коэффициентов финансовой устойчивости МКПАО «Лента» за 2023-2025 гг.'. Highly readable, precise data visualization, clean layout.
Free to start · Generate videos and images with AI in seconds