

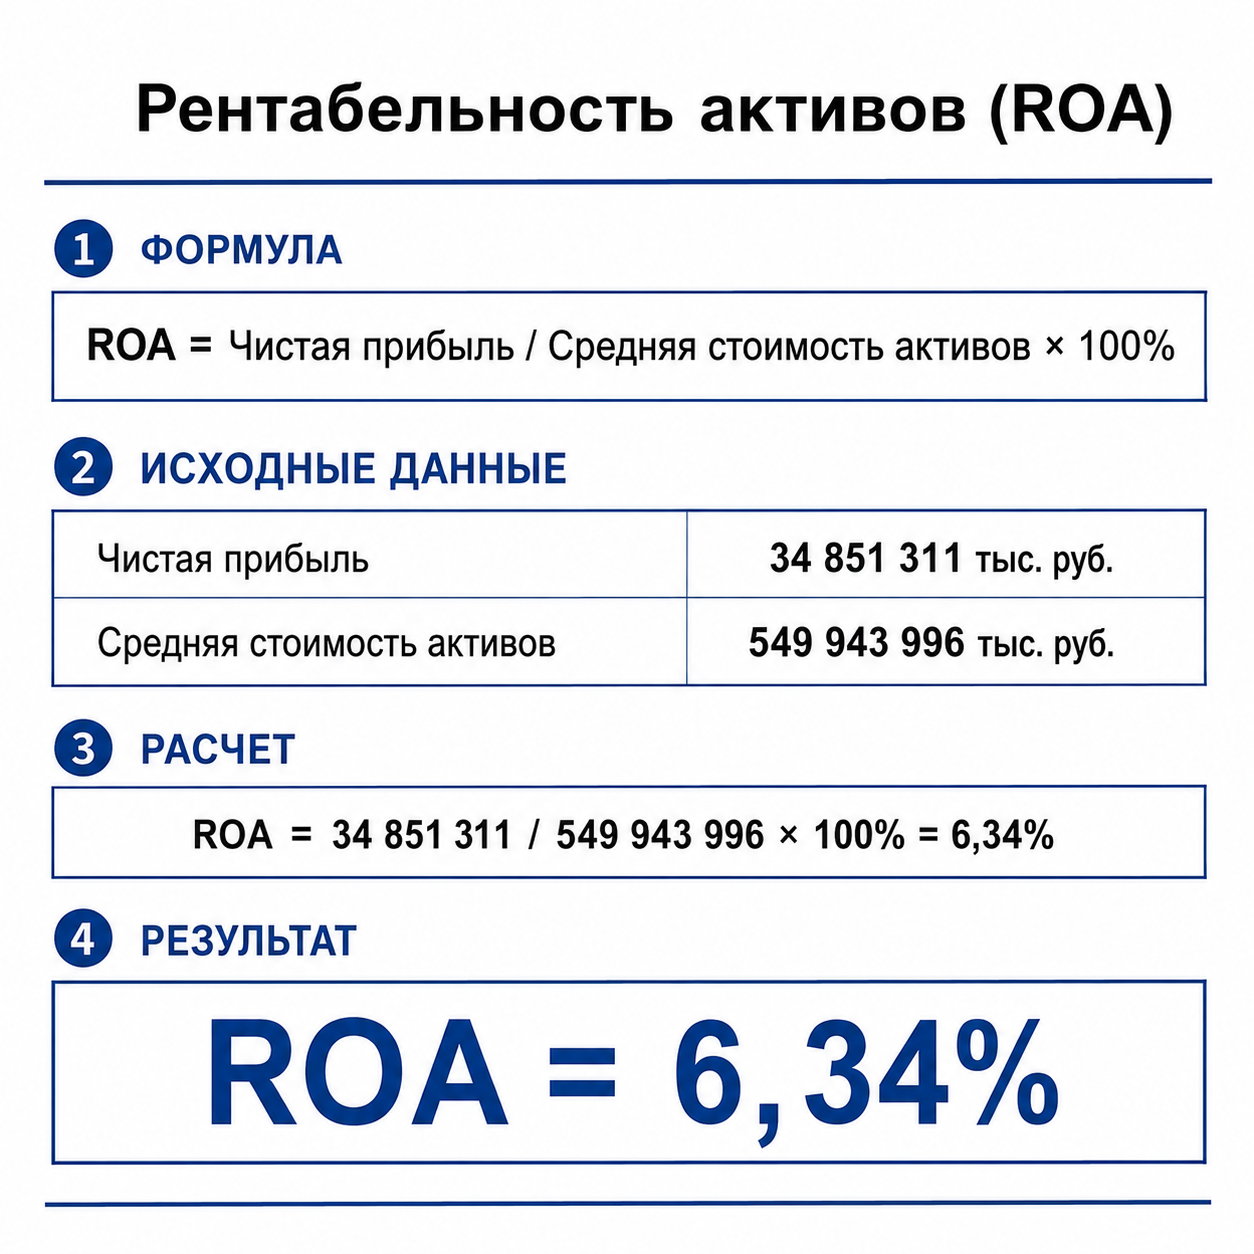


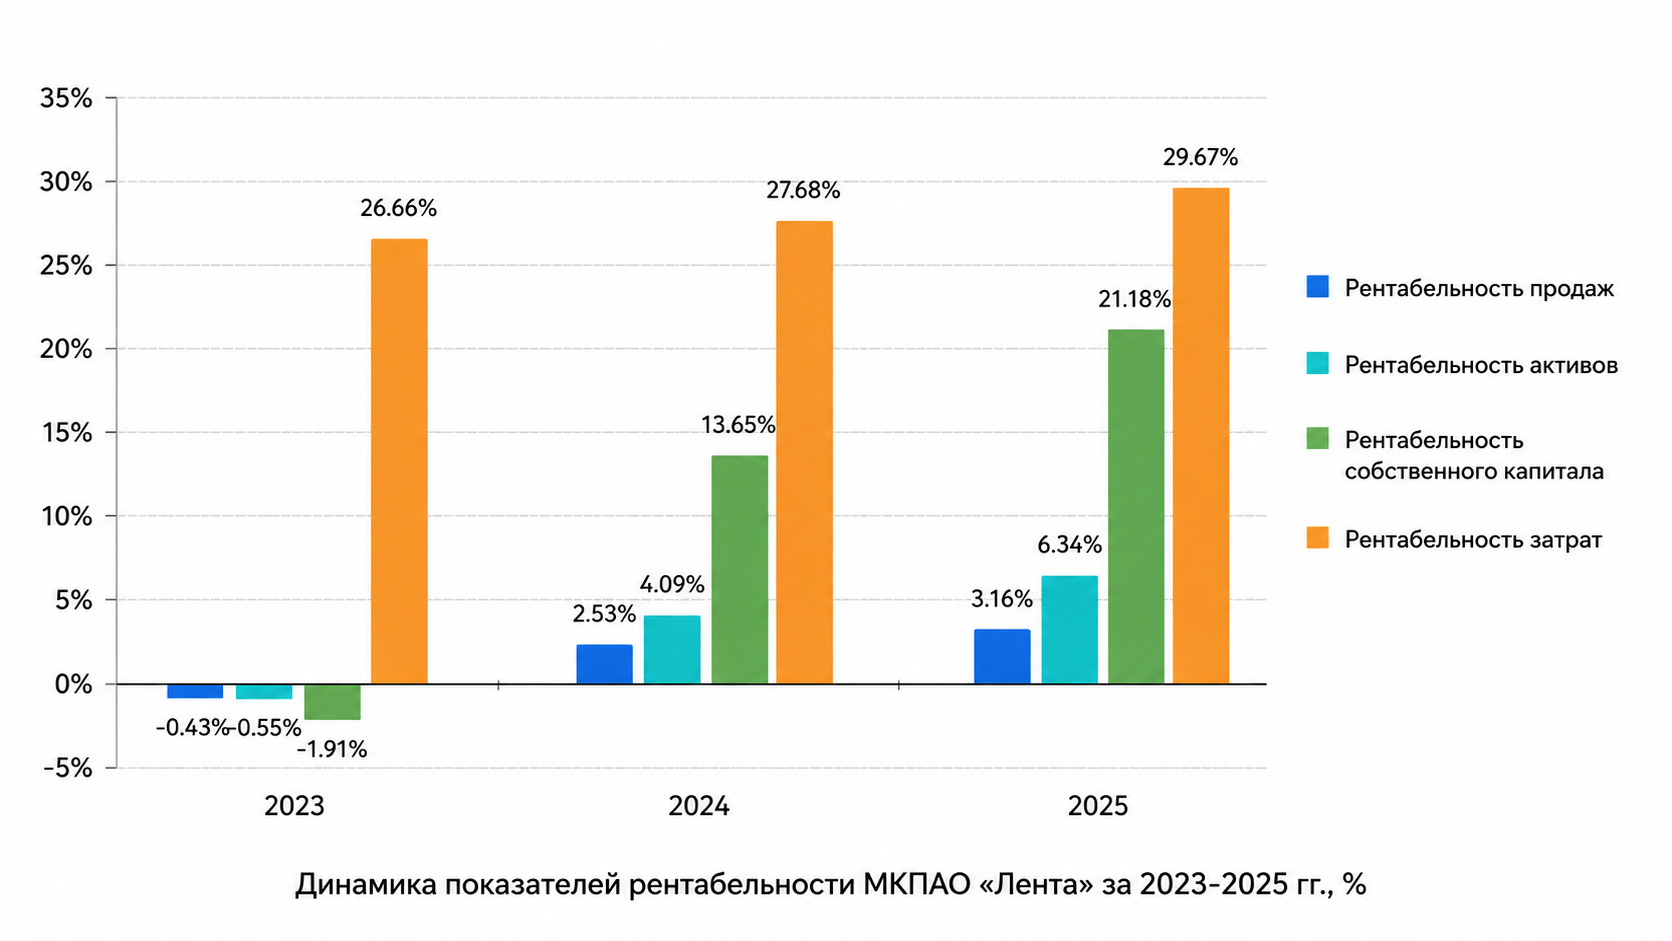
A professional minimalist academic presentation slide for a diploma, pure white background, aspect ratio 16:9. Flat corporate infographic design, strict business style, no 3D, no gradients, no shadows. A clustered bar chart is in the center. The Y-axis on the left has a scale from -5% to 35%, with a step of 5. Thin, light gray horizontal grid lines are present. The X-axis at the bottom has three groups of bars, labeled '2023', '2024', and '2025'. In the 2023 group: a blue bar at -0.43%, a turquoise bar at -0.55%, a green bar at -1.91%, and an orange bar at 26.66%. In the 2024 group: a blue bar at 2.53%, a turquoise bar at 4.09%, a green bar at 13.65%, and an orange bar at 27.68%. In the 2025 group: a blue bar at 3.16%, a turquoise bar at 6.34%, a green bar at 21.18%, and an orange bar at 29.67%. The exact percentage value is clearly labeled on or just above/below each bar. On the right side of the chart, there is a clear legend: a blue square icon with text 'Рентабельность продаж', a turquoise square icon with 'Рентабельность активов', a green square icon with 'Рентабельность собственного капитала', and an orange square icon with 'Рентабельность затрат'. Centered at the very bottom of the slide is the title: 'Динамика показателей рентабельности МКПАО «Лента» за 2023-2025 гг., %'. All fonts are a clean, highly legible sans-serif type like Arial/Calibri.
Free to start · Generate videos and images with AI in seconds